Helene D. Gayle has rightly said “The difference between rich and poor is becoming more extreme, and as income inequality widens the wealth gap in major nations, education, health and social mobility are all threatened.”
The unexpected crisis created by the Covid 19 disturbed the entire economy; the impact of the pandemic can still be seen. It shut down many sectors of the economy, which in turn affected the livelihood of many around the globe. The gaps between rich and poor is widening. Economic inequality is rising.
Economic Inequality refers to the unequal distribution of income and opportunity between different groups in society. A sharp rise in income inequality not only increases social and political concerns but economic ones as well.
A recent report published by The World Inequality Lab, a research center at the Paris School of Economics highlights the level of global economic inequality prevailing today. It presents comprehensive data on inequality at the global level.
Here are some notable points from the report:
THE COMPOSITION
To describe the extent of global inequality, the report focuses on the shares of income captured by different groups of individuals in the income distribution worldwide. It focuses on the income or wealth distribution across the global adult population of 5.1 billion individuals as of 2021.
The bottom 50% of the adult population, or the poorest half of the world population today consists of 2.5 billion individual adults. The middle 40% represents the population earning more than the bottom 50% and less than the top 10%. The top 10% is made up of 2 billion adults. The global 10% represents one-tenth of the world population i.e. 517 million adults. The global 1 percent are the richest 51 million individual adults.
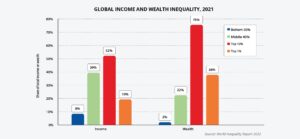
Interpretation: In the year 2021, The global bottom 50% population captures 8.5% of total income measured at PPP (Purchasing Power Parity) and owns 2% of the wealth. The middle 40% owns 39.5% of total income and 22% of the wealth. The global top 10% owns 76% of household wealth and captures 52% of total income. The total income of top 1% global population stands at 19%. Their wealth is 38%.
GLOBAL INCOME DISTRIBUTION
In the year 2021, the global income amounts to $122 trillion, while global net wealth stands at six times this value, i.e. €510 trillion. The global average income per adult in 2021 is $23,380 or PPP $1,950 per month, while the average adult individual owns $139,000 in net wealth. These average values mask prominent inequalities between countries and their citizens.
If all the income are split equally worldwide, i.e. if everybody earned $23,380 per year, then the global bottom 50% of individual adults would have captured 50% of the global income. Likewise, the global top 10% would have captured 10% of the total income.
- Today, the global bottom 50% captures a very small portion of the global income i.e. only 8%. What does this mean? This means that, on average, the bottom 50% earns slightly less than one-fifth of the global average, i.e. €230 per month or €2,800 per year.
- The global middle 40% earns 39% of the total. Its income is €1,375 per month (€16,500 per year).
- The global top 10% earns 52% of the total. Its average income lies at €7,300 per month(€87,200 per year)
GLOBAL WEALTH DISTRIBUTION
The statistics concerning global wealth are more unfortunate than global income.
- The poorest half (bottom 50%) of the world owns just 2% of the total net wealth while the richest half owns 98% of the total wealth on the planet.
- The bottom 50% owns €2,900 of assets (land, housing, cash, or other deposits).
- The middle 40% owns just 22% of the wealth; an average of €40,900 per adult
- The top 10% owns 76% of the wealth; an average of €550,900 per adult
GLOBAL INCOME AND WEALTH INEQUALITY BETWEEN COUNTRIES
The global income and wealth inequality between countries has two aspects:
- Inequality between countries or regions
- Inequality within countries
Global Income Inequality
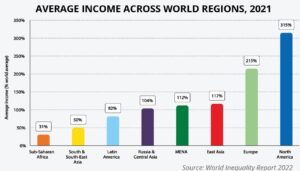
The average income in Sub-Saharan Africa is 0.3 i.e. 30%. South and Southeast Asia earn 0.5 i.e. 50% of the global average income. Latin America, Russia & Central Asia, and East Asia earn 82%, 104%, and 117% average incomes respectively. In Europe, the ratio reaches twice the global average i.e. 215%. In North America, the ratio is three times higher which means that North Americans earn 10 times more, on average than sub-Saharan Africans, South and Southeast Asians. East Asians earn almost half of what Europeans earn.
Global Wealth Inequality
As per the findings of the report, the wealth disparities between rich and poor countries are higher than income disparities.
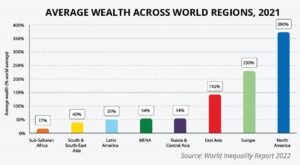
SubSaharan Africans, South and Southeast Asians, and Latin Americans own just 30-60% of the global average wealth. The Middle East and North Africa (MENA) and Russia & Central Asia own 54% and 142% of average wealth. Europe and North America stand tall at 230% and 390% respectively. It is often argued that poor countries are poor because they do not use their capital resources efficiently. However, the argument is incorrect. Poor countries are comparatively better off in utilizing capital resources but have very little capital to start with.
INCOME & WEALTH INEQUALITIES: INSIGHTS INTO INDIA
India was ruled by the Britishers for almost 200 years. Its income inequality was very high during 1858-1947, with a top 10% income share around 50%. Post independence, the five year plans contributed to reducing this share to 35-40%. Although, from the 1980s, the policies of liberalization and deregulation led to the most significant increase in income, but the top 1% has enjoyed the larger benefits. The growth among low and middle income groups has been relatively slow.
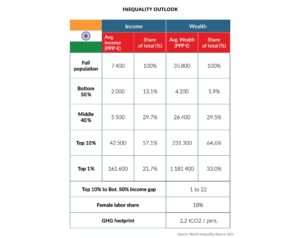
The average national income of the Indian adult population is €PPP7,400 or INR 204,200. While the bottom 50% earns €PPP 2,000 or INR53,610, the top 10% earns (€PPP 42,500 or INR1,166,520 which is 20 times higher. The top 10% and top 1% hold 57% and 22% of total national income. The middle 40% and bottom 50% share of total income is 29.7% and 13% respectively.
Regarding wealth inequality, the average household wealth in India is equal to €PPP35,000 or INR983,010. The bottom 50% owns almost nothing i.e. 6% of total average wealth. The middle class is also relatively poor with an average wealth of only €PPP 26,400 or INR723,930, 29.5% of the total. The top 10% and 1% own respectively €PPP 231,300 (65% of the total) and over €PPP 6.1 million (33%), INR6,354,070, and INR32,449,360.
FINAL WORDS
Over the last two decades, global inequalities between countries have declined but the income inequality has increased within most countries. The need is to address this burgeoning challenge of income and wealth inequality. It is not ‘feasible without significant redistribution of wealth and income inequality’, as argued by the author of the report.
Source: The report draws insights from “World Inequality Report (WIR) 2022” published by The World Inequality Lab, a research center at the Paris School of Economics on December 7, 2021.

